Building in the open
Why a performance score is not enough
A number out of 100 is useful. It is also incomplete. It can tell you the page is slow without telling you what to change, or whether the change you made actually helped.
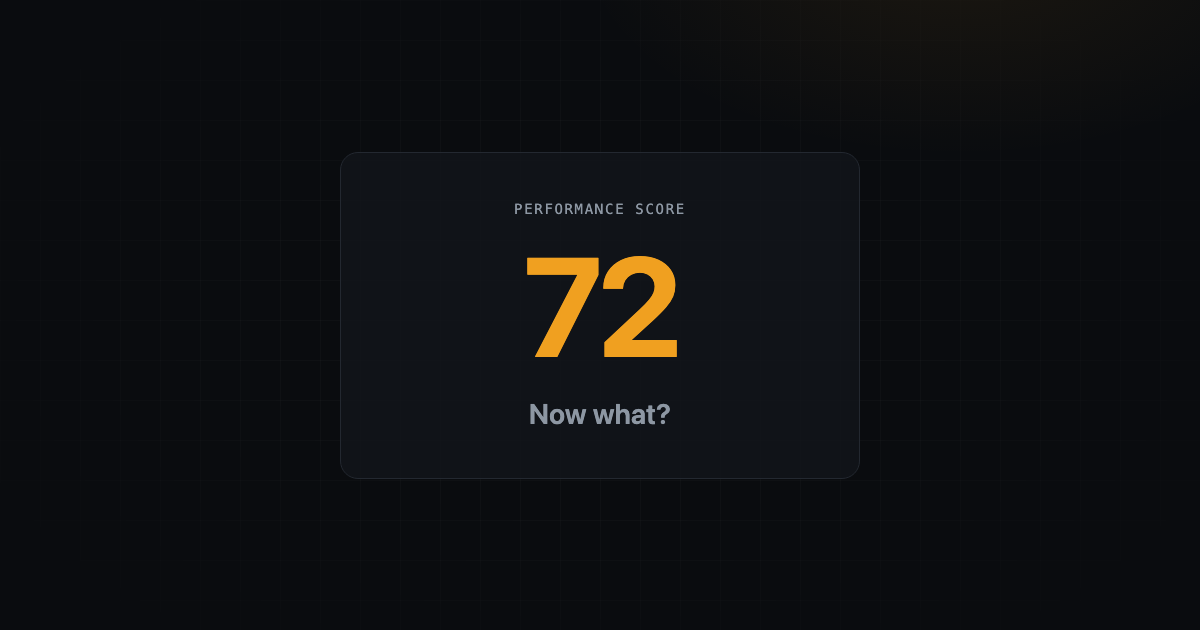
Most people meet web performance the same way. They open PageSpeed Insights or Lighthouse, wait for the report, and stare at a score.
72. Or 41. Or 98.
Then the room goes quiet, because the next question is the hard one.
What the score is good for
A performance score is a quick health check. It compresses a few timings into one number you can compare later.
On a pretend slow phone, on a pretend poor connection, Lighthouse times the page and turns those timings into points. Only five things carry marks. The rest of the long list is advice.
If you want the maths, I wrote that up separately in the scoring guide. This piece is about the gap after the number.
The score is a signal that something needs attention. It is not a plan.
What it leaves out
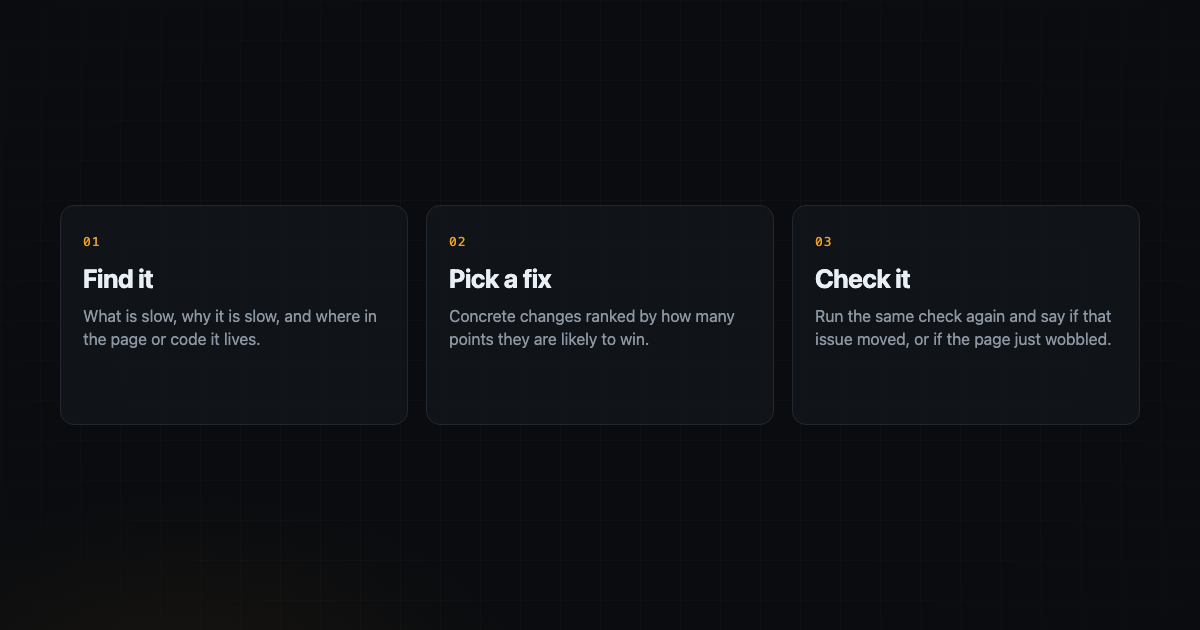
When a page is slow, three questions matter more than the grade.
- What exactly is wrong? Not “LCP is bad.” Which element. Which request. What caused it. What triggered it. Where in the code or file it lives, when that can be known.
- What should you try first? Reports dump a pile of tips. Most of them score zero on their own. Nothing ranks them by points you are likely to win.
- Did that issue move? Running the tool once more after a change is not enough. The score moves on its own between untouched runs.
Paste the same report into an AI coding tool and you often get activity without judgment. The agent picks whatever looks worst, edits something, runs one more test, and calls it done. That loop cannot tell a real gain from normal wobble.
The score moves by itself
This is the part that made me stop trusting a single run.
I measured the same page twice. Nothing changed between the runs. The score still jumped by 9 points.
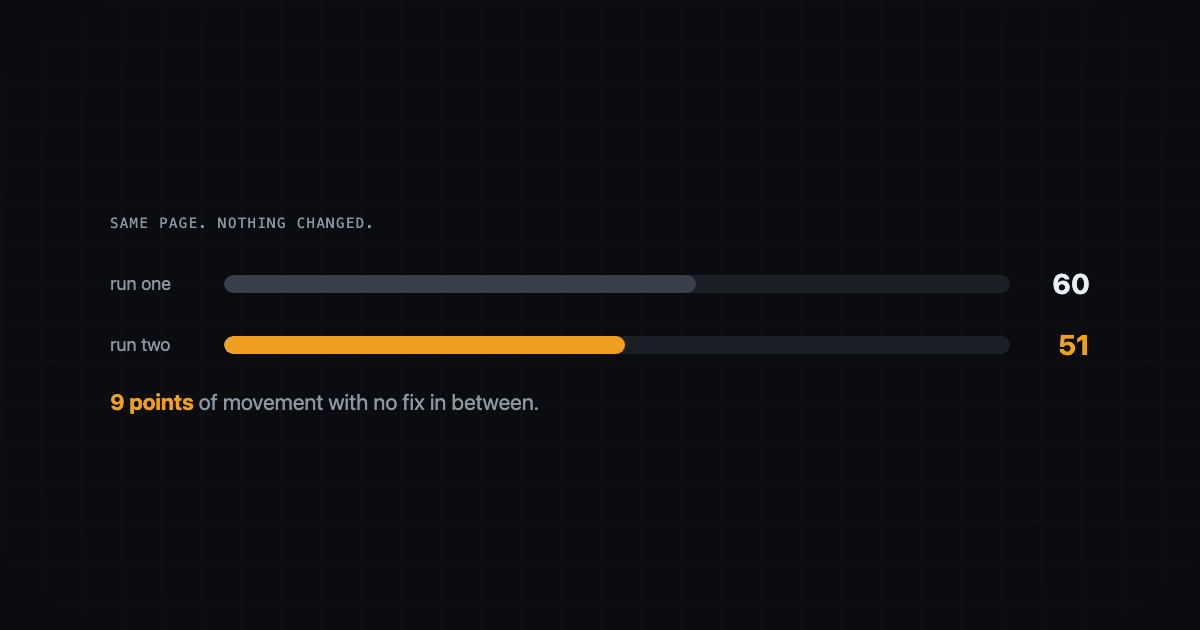
Nine points is bigger than a lot of real fixes are worth. Ship a change between two noisy runs and you cannot tell your work from the movement the page already had.
So “the score went up” is not the same as “the issue is fixed.”
What I am building instead
PafCore is my attempt to close that gap.
The product I want is simple to say:
- Identify the issue, the cause, and the location when the data supports it.
- Resolve with a concrete change you can choose. The tool does not apply the fix for you.
- Verify under repeated measurement, with the page’s own noise in view.
- Verdict on that issue: resolved, not resolved, or cannot verify.
That is the full aim. It is not finished.
There is an experimental CLI that measures the Lighthouse score and how much it moves between runs. The cause tracing, ranked fixes, and issue level verification above are still being built. I am writing about the work as it happens.
One recent lesson from the lab work: I was loading the same page twice and treating both visits as one story. The numbers argued with each other. One load now. The score and the “why” need to come from the same visit.
When a score is enough
Sometimes a number is all you need. A quick check before a release. A before and after screenshot for a slide. A rough sense of whether a page is in trouble.
Use it for that.
When you need to decide what to change next, or prove a change worked, the score alone runs out. That is the hole I am filling.
Follow the build
If this problem has bitten you, the scoring guide is live, and I am shipping the rest in public. No hard sell. Just the work.
Get updates